

Histogram in photography – a topic often perceived as too complex or unnecessary by many photographers. But let me tell you, they are far from it. Once you learn how to read histogram and how to use it effectively, it becomes an invaluable tool, like a secret weapon in your photographic arsenal.

This guide is your key to unlocking the power of histograms, the most important tool in your kit for nailing exposure with every shot. I will not only teach you how to understand histograms but also show you practical techniques for using them in real-world photography.
Additionally, I’ll provide insights into how I use histograms, revealing my camera settings, to achieve perfect exposure with every shot I take, and you can do the same. So, join me on this journey, and let’s demystify histograms and master the art of exposure.
What is Exposure in Photography?
Exposure in photography refers to the amount of light that reaches the camera’s image sensor to create an image. It is a fundamental and critical concept in photography as it directly impacts how bright or dark an image looks and affects the overall quality and appearance of a photograph.
Let’s see how exposure is related to the histogram.
What is a Histogram in Photography?
In photography, a histogram is a graphical representation of the exposure levels (brightness) within an image. It displays how many pixels in the image have a particular tonal value, ranging from pure black (shadows) on the left side of the histogram to pure white (highlights) on the right side, with various shades of gray in between.

The horizontal axis represents the range of tonal values, while the vertical axis shows the number of pixels with each tonal value.
Shadows represented on the left side of the histogram, indicate the darker areas in the image.
Highlights are shown on the right side of the histogram, they represent the brighter areas in the image.
Midtones Found in the middle of the histogram, account for the tones that are neither very dark not very bright.
As you can see, the histogram is a visual representation indicating the brightness or darkness of various areas of the image from the camera sensor’s perspective. In a nutshell, the histogram is a visual representation of the exposure.
The goal of the histogram is to give photographers more information to accomplish the task of properly exposing photos.
Before we move to practical applications of histograms, let’s address some fundamentals.
What is Histogram Clipping in photography?
Histogram clipping in photography refers to a situation in which image data falls outside the dynamic range of the camera sensor that can be accurately recorded or displayed. It typically occurs at both ends of the histogram – in the highlights (right side) or shadows (left side).
Clipping the Shadows (Underexposing)
Shadow clipping, also known as underexposure, occurs when the histogram of an image is touching the left side of the graph. This means that the darkest parts of the image have lost detail and appear as solid black. When shadow clipping happens, it indicates that the image is underexposed, which means that not enough light reaches the camera sensor to capture the full range of shadow details.
Underexposure can lead to several issues in a photograph:
Loss of Detail: The darkest areas of the image, such as shadows and low-light regions, lack detail and appear as featureless black areas. This can result in the loss of important information and a lack of depth in the photo.
High Noise: Underexposed areas may exhibit increased digital noise, making the image appear more distorted.
Reduced Dynamic Range: The dynamic range, which represents the range of tones from shadows to highlights, becomes limited.
Difficulty in Post-Processing: Correcting underexposed images in post-processing can be challenging or even impossible. When clipped areas do not contain any information, they always stay black. You can not recover something out of nothing.
Highlight Clipping (Overexposure)
Highlight clipping, also known as overexposure in the context of highlights, occurs when the histogram of an image touches the right side of the graph. This means that the brightest parts of the image have lost detail and appear as solid white or featureless blobs. When highlight clipping happens, it indicates that the image is overexposed in its highlights, meaning that too much light reached the camera sensor, causing the brightest areas to lose detail and be clipped.
Here are some key points about highlight clipping (underexposure in highlights):
Loss of Highlight Detail: The brightest areas of the image, such as overexposed skies or light sources, lack detail and appear as solid white. This results in the loss of important information and can make the image appear washed out.
Data Recovery Is Impossible: Clipped highlights contain no recoverable image data. Once the highlights are clipped, the information is lost, and it cannot be recovered in post-processing. This is why it’s essential to avoid highlight clipping.
Reduced Dynamic Range: The overall dynamic range of the image is reduced when highlight clipping occurs.
How to Read a Histogram Graph
Underexposed Histogram
An underexposed histogram is a graphical representation of image data where the majority of the pixel values are concentrated towards the left side of the graph, touching the edge, which indicates a lack of data in the shadow areas. This type of histogram suggests that the image is too dark or underexposed.

Histogram Exposed to the Left
A histogram exposed to the left, also known as “exposure to the left” (ETL), refers to a shooting technique where an image is intentionally underexposed. In this case, the photographer deliberately captures the image with less light, resulting in darker shadows and well-preserved highlights.
ETL method was more common in film photography to avoid excessive grain or loss of detail in the highlight areas, which could occur when overexposing the film.

Neutral Histogram
A neutral histogram, sometimes referred to as a “balanced” or “even“, is one where the data is evenly distributed across the entire range of tones from shadows (left side) to highlights (right side) without touching either end. In other words, it means that there are no “clipped” shadows or highlights, and the majority of the data is concentrated in the midtones.
See also: Exposure Triangle
Histogram Exposed to the Right
In photography, an Exposure to the Right (ETR) refers to a specific technique where you intentionally push the exposure of an image to the right side of the histogram without actually clipping the highlights. This technique is often used to maximize the amount of data captured in the darker areas of the image, particularly in the shadows, and minimize its noise level.


This is the technique I use most often in my photography.
Overexposed Histogram
An overexposed histogram is one where the data is skewed towards the right side and the histogram touches the right side of the graph It indicates that the image contains areas where the highlights are so bright that they are “clipped.” Overexposed images suffer from a loss of detail in the brightest areas, making it impossible to recover information from those regions during post-processing.
HDR or High Contrast Histogram
When you encounter a histogram that extends to both sides of the graph, it’s an indicator of an extreme range of light situation. In this context, both the shadows and highlights are “clipped”, signifying that the range of light you aim to capture exceeds the capabilities of your camera sensor’s dynamic range.
To tackle this challenge, you’ll need to employ the High Dynamic Range (HDR) photography technique. The fundamental concept involves taking multiple shots of the same scene at various exposure levels. Later, during post-processing, you’ll merge these differently exposed images into a single HDR image.
HDR process allows you to preserve the complete dynamic range of the scene, ensuring that both the shadow and highlight details are captured.


What Is the Perfect Histogram?
Sorry to disappoint you, but there is no universally perfect histogram for all images. However, there is an optimal histogram that is image-specific and can vary depending on the particular scene, subject, and the photographer’s style and creative intent.
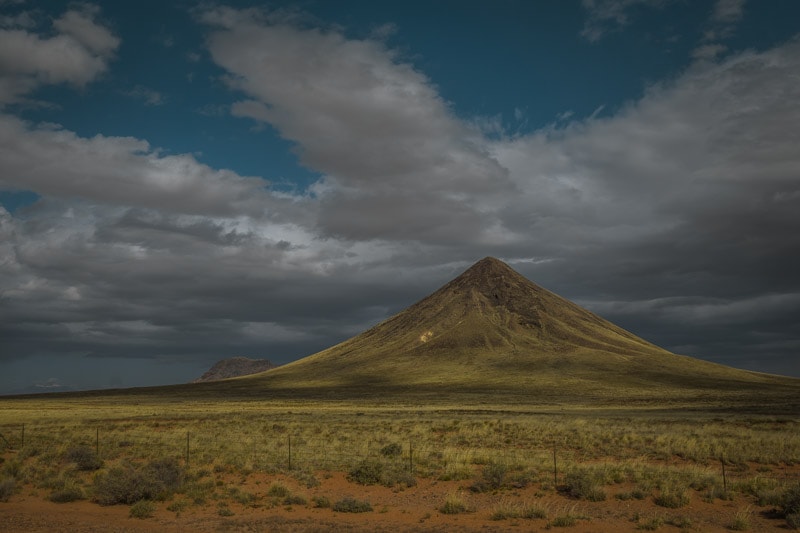
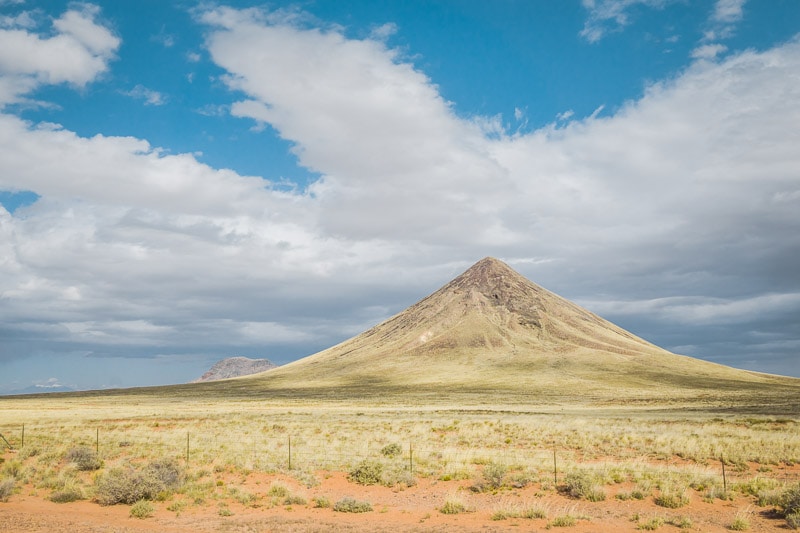
For instance, my preferred exposure technique is “Exposure to the Right” (ETR). This means that my optimal histogram for a landscape scene will be slightly overexposed. Conversely, for a photographer using the “Exposure to the Left” (ETL) technique, that same scene would be slightly underexposed, aligning with their shooting style and preferences.
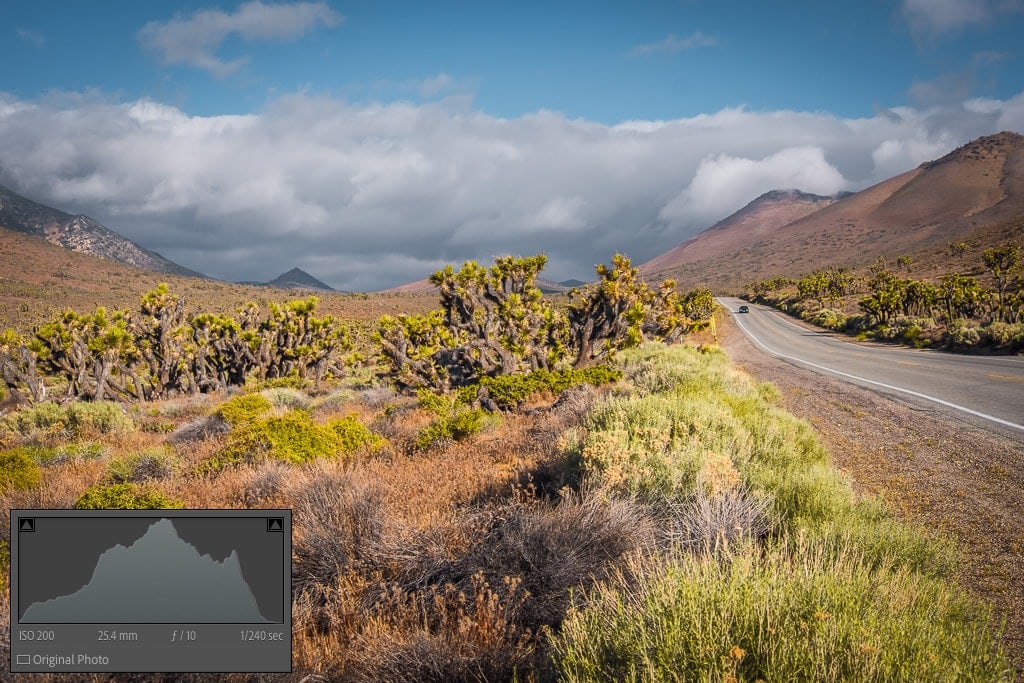
Let me provide you with an example (see below). You can capture the same scene using three different exposure techniques: Neutral, ETL, or ETR. Each of them can be used to create the final photo. However, in my experience, I have found that employing the ETR (exposure to the right) technique results in the cleanest RAW file with minimal digital noise.


When to Use the Histogram On Camera
My approach is to always take advantage of the histogram functionality, which has consistently helped me achieve nearly 100% accurate exposures.
With the advancements in mirrorless cameras, you no longer need to capture a photo before accessing the histogram. You can evaluate the exposure level of the scene by examining the histogram before taking the shot.
Today, there’s no reason not to take advantage of the histogram.
How to Use the Histogram On Camera
Allow me to demonstrate how I use histograms in my photography.
Over the years, I’ve developed an exposure technique that is not only effective but also seamlessly integrates into my shooting and post-processing workflow. Two events have significantly contributed to its refinement.
First, I made the switch from Sony to Fujifilm. With my new Fujifilm XT2, I gained access to advanced histogram functionality, a feature I hadn’t encountered with my previous camera models. The latest firmware update, available at the time, allowed me not only to display the combined histogram for the scene before taking the shot but also separate histograms for each color channel (RGB) on demand. In total, I had access to four versions of histograms, offering me unprecedented control over the exposure.
Second, while perusing technical publications, I stumbled upon a piece of information regarding digital sensors—something I wasn’t previously aware of. It stated that to maximize the performance of any digital image sensor, it’s essential to saturate it with light. Essentially, the higher the exposure for any given scene, the better the quality of images it will produce.
This is when it clicked for me. I understood that the right exposure technique is ETR (exposure to the right) and the histogram function is the main tool to control it.
My camera settings:
Camera Mode: Aperture Priority
Metering Mode: Multi on Fujifilm (Evaluative Metering, Matrix, Multi-zone on other brands)
Drive Mode: Single Shot
File Format: RAW (important)
My exposure setting technique:
- I set the aperture to a value between f/8 and f/13, depending on the situation.
- I point the camera toward the scene I am planning to photograph.
- I lock the exposure by pressing the AEL button.
- I activate the histogram inside EVF by pressing the front customizable button.
- I adjust the Exposure Compensation value with the help of the front command dial. While changing the Exposure Compensation I use 4 active histograms inside EVF as a guide. My goal is to boost exposure as high as possible without “clipping” the highlights.
- I press the shutter release button when I am done with Exposure Compensation adjustments.
Here’s why it’s crucial to have individual histograms for each color channel. While the combined histogram might suggest that highlights aren’t clipped, this can be misleading, especially when capturing landscapes with wide, clear blue skies. In such scenarios, the blue channel tends to get clipped first. To ensure an accurate assessment of highlight integrity, it’s important to evaluate individual channels when making Exposure Compensation adjustments.
The result of such a technique is slightly overexposed photos. The goal is to get the best quality digital files in-camera. I address proper exposure later in post-processing in Lightroom. Given that I consistently shoot in RAW format, there is no quality penalty associated with this approach.
How to Use the Histogram in Lightroom
The Histogram in Lightroom is just as useful as using it on your camera. It acts as a reliable indicator to prevent your photo from being “overcooked” during the editing process.
To access the histogram in Lightroom, navigate to the Develop Module. You’ll find the Histogram Panel at the top right corner of the interface. Click on it to open the histogram.
With the Histogram Panel open, you can enhance its functionality by activating the “Show Shadow Clipping” and “Show Highlight Clipping” features. To do this, simply click on the two small triangles located in the top corners of the panel.
Once these features are activated, the histogram becomes an even more powerful tool. When you clip the shadows in your image during editing, the affected area will be highlighted in blue. Similarly, if you clip the highlights, the clipped area will be indicated in red.
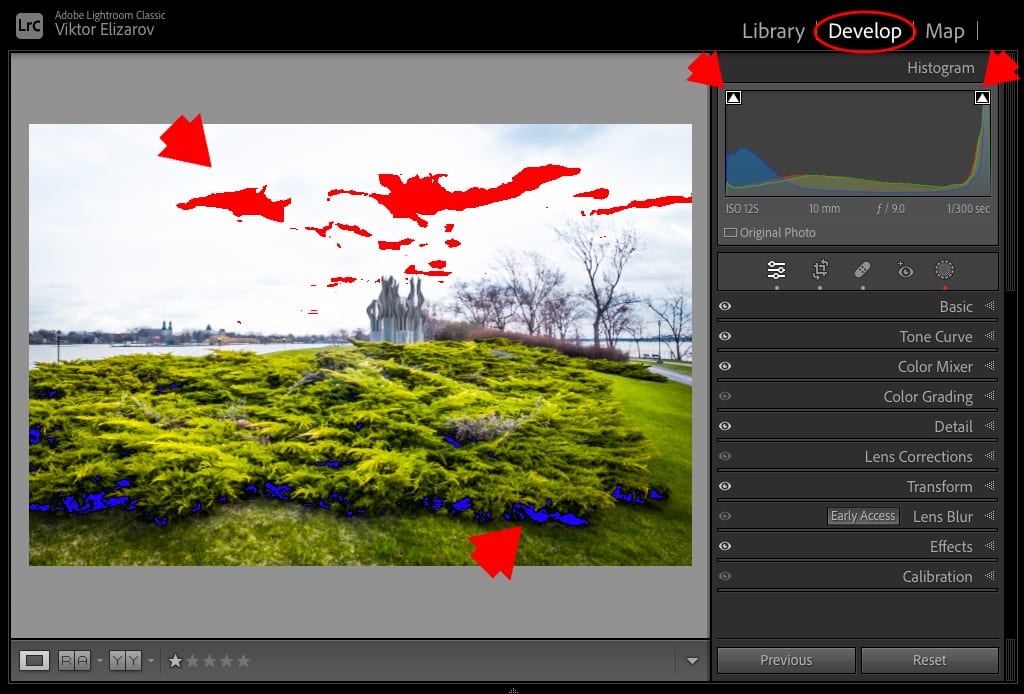
To make the most of this tool, I recommended keeping the Histogram Panel open at all times while you work on your photo editing. This way, you can use it as a reliable guide to ensure your image retains the right tonal balance throughout the editing process.
Using the Histogram in Lightroom as an Interactive Tool
The Histogram Panel in Lightroom serves a dual purpose: it aids in exposure evaluation and enables interactive editing.
It is divided into five areas, namely Blacks, Shadows, Exposure, Highlights, and Whites. Adjusting these parameters visually is as simple as dragging them to the left or right. This visual and interactive method of performing basic adjustments streamlines the editing process.
For an in-depth exploration of Lightroom Histogram Editing, including a case study that highlights the efficiency and enjoyment of exclusive editing with the Histogram Panel, check out my dedicated article on the subject.
How to Recover Overexposed Images in Lightroom
You might be wondering how it’s possible to salvage “clipped” highlights when they appear to contain no retrievable information. As the saying goes, “you can’t recover something out of nothing.”
You’re correct in noting that truly clipped highlights cannot be recovered. However, there’s a twist to this.
The Histogram on your camera and in Lightroom isn’t based on RAW data. Both camera manufacturers and Adobe take a bit of a shortcut here. They generate histograms based on embedded JPEG preview images. It seems that creating histograms directly from RAW data could be too processor-intensive, so they make this compromise.
See also: JPEG vs RAW
The catch is that JPEGs are compressed images, and consequently, they have a narrower dynamic range compared to RAW files. In practical terms, this means that if you end up with an image showing “clipped highlights,” there’s a chance to recover the actual RAW data within Lightroom.
Additionally, Lightroom features a lesser-known function of the Exposure slider. Besides increasing the image’s brightness, it comes with a built-in recovery algorithm. When Lightroom detects that one of the three color channels is “clipped,” it attempts to reconstruct it using data from the intact channels.
The success of this recovery process can be variable; sometimes it works, and sometimes it doesn’t. But you won’t know until you give it a try.


For a detailed guide on how to recover overexposed images in Lightroom, check out my dedicated tutorial: How to Fix an Overexposed Photo in Lightroom.
Histogram in Photography & How to Read a Histogram | Final Thoughts
Understanding and how to use histograms in photography is not just a technical endeavor; it’s an art form that allows you to master exposure. Histograms, often overlooked and misunderstood, are, in fact, powerful tools that enable photographers to achieve the perfect balance between shadows and highlights, resulting in compelling and well-exposed images.