

The Lightroom Histogram Editing is a powerful yet often lesser-known tool within Adobe Lightroom. While many photographers are familiar with the basic editing features, the potential of the Lightroom histogram remains obscured to most.
In this article, I will shed light on this functionality and explore how it serves as an effective interactive editing tool, capable of streamlining your photo post-processing in Lightroom.
What is Histogram in Lightroom Classic?
In Lightroom, a histogram is a graphical representation of the tonal distribution in an image. It displays the distribution of pixels based on their brightness values, from pure black (shadows) on the left side of the histogram to pure white (highlights) on the right side. The horizontal axis of the histogram represents the range of tonal values, while the vertical axis shows the number of pixels at each tonal value.
What Lightroom Histogram Tells Us?
The Lightroom histogram graph provides essential information about an image’s exposure and tonal distribution, helping you evaluate and adjust the brightness, shadows, highlights, and overall tonal balance. By analyzing the histogram, you can make informed decisions about your image’s exposure and make necessary adjustments to achieve your desired look.
One of the most valuable information that Lightroom Histogram provides is “clipping” information.
Clipped Highlights and Clipped Shadows Information
Histogram clipping in photography occurs when the data in an image exceeds the dynamic range capabilities of the camera sensor for accurate recording or display. This issue usually arises at both extremes of the histogram, namely in the highlights (right side) and shadows (left side).
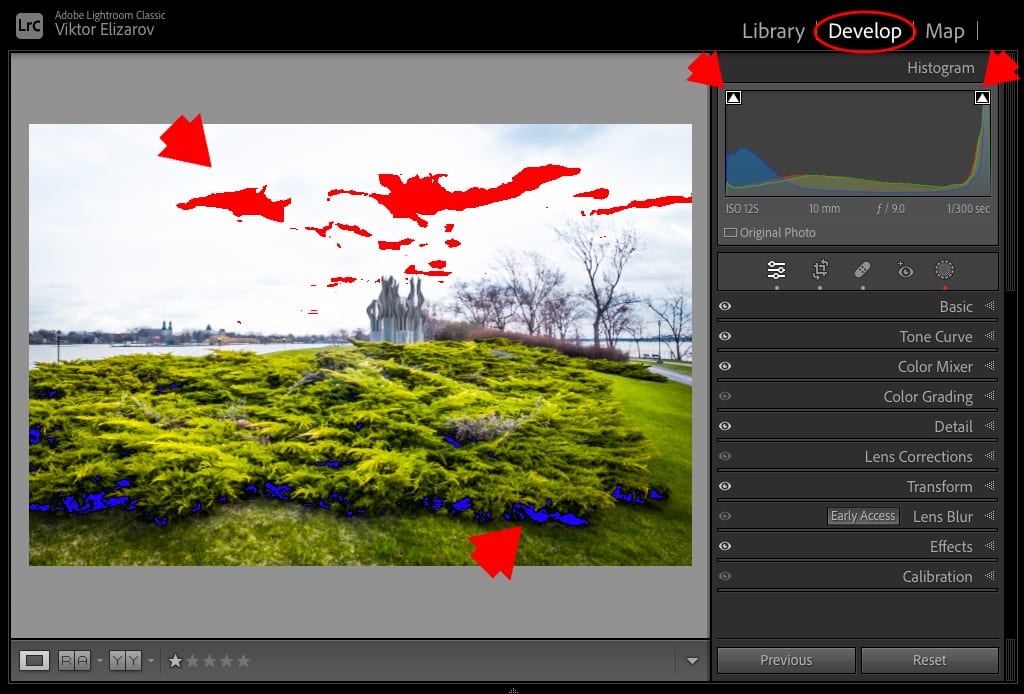
Lightroom’s histogram includes clipping indicators ( you can toggle them on and off) that can reveal whether any areas within your image have lost detail due to overexposure (highlights clipping) or underexposure (shadows clipping). When overexposed or underexposed regions are detected, they are highlighted in red (for overexposure) or blue (for underexposure) within the histogram.
When you look at the histogram, you can see that both the highlights and the shadows are clipped.
While most photographers use the Lightroom histogram for assessment purposes, many are unaware of its potential as a powerful editing tool.
Allow me to demonstrate how.
How to Use the Lightroom Histogram as an Editing Tool
Regardless of whether you use preset-based editing or prefer a freestyle workflow, anytime you dive into Lightroom’s main editing tools on the right panel, you always need to adjust the basics. What I mean by basics are exposure, shadows, and highlights. I would say that 99% of the time, I need to tweak or adjust those edits.
Typically, you’d access the BASIC editing panel in Lightroom and use the corresponding adjustment sliders.
See also: Histogram in Photography & How to Read a Histogram
There is also one more way to achieve the same results by taking advantage of Lightroom Histogram interactivity.
Using the Lightroom histogram as an interactive tool to edit images is a fun and valuable technique that allows you to make adjustments by dragging specific areas of the histogram.
Step 1
Start by importing your image into Lightroom and entering the Develop module where you can access editing tools.
Step 2
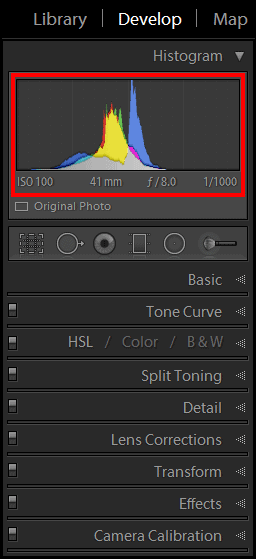
To access the histogram in Lightroom, navigate to the Develop Module. You’ll find the Histogram Panel at the top right corner of the interface. Click on it to open the panel.
Step 3
The histogram is divided into five areas, including Blacks, Shadows, Exposure, Highlights, and Whites. These areas correspond to different tonal ranges in your image.
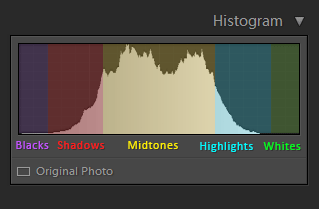
To begin editing, hover your mouse cursor over the area of the histogram that corresponds to the tonal range you want to adjust. For instance, if you want to modify the exposure, place your cursor over the Exposure area.
Step 4
With the area selected, drag it left or right along the horizontal (x-axis) direction. Moving it to the left will decrease the value while moving it to the right will increase it.
For example, if I need to adjust the Exposure in my photo, I select the biggest area in the middle of the Histogram Panel and drag it to the left if I want to decrease the exposure or to the right if I want to increase it.
Below the histogram, you’ll notice the selected parameter’s name on the left and its value on the right. This provides a numerical reference for the adjustment you’re making.
And here are the corresponding editing sliders from Lightroom Basic Panel:
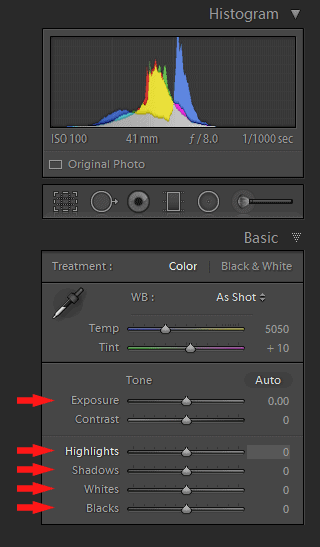
As you drag, you’ll immediately see the impact on your image in the main preview window. At the same time, the value of corresponding editing sliders in the Basic Panel will change as well.
This interactive process allows you to fine-tune the image’s exposure, shadows, highlights, or other tonal aspects.
Related: Lightroom Workflow Tips
This visual and interactive tool makes basic adjustments both a very rapid and fun process.
Lightroom Histogram Editing Case Study
Today, I am going to demonstrate how to use the Histogram Panel only to edit the image.
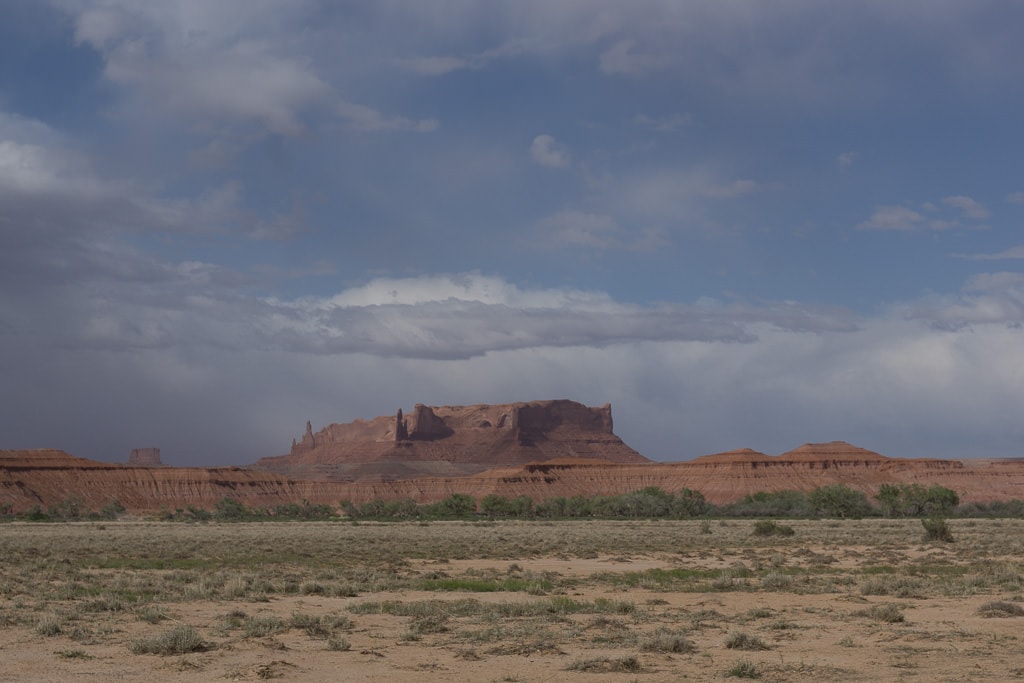
Here is the original, unprocessed RAW photo I took while driving from Arizona to Utah during my latest Southwest trip.
Step 1: Highlights and Shadows Recovery
The first step is to recover Highlights and Shadows.
I select the Highlights area of the Lightroom Histogram panel and dragged it all the way to the left until I reaches value of -100.
Next, I select the Shadows area and dragged it all the way to the right. I set the maximum possible value of +100.
The result of the recovery was somewhat flat and unappealing.

Step 2: Contrast and Saturation Boost
Next, by boosting the Whites and Blacks I can increase the contrast and saturation.
I set the value of Whites to +55 and value of Blacks to -69. Once again, I can achieve it by selecting appropriate area and dragging the on x-axis.

As you can see, you can boost the contrast and saturation without using the dedicated Saturation and Contrast sliders.
Step 3: Adjusting Exposure
The last step is to select Exposure area in the middle of Lightroom Histogram and drag it to the right until the photo looks properly exposed.
The Exposure value of +0.40 looks about right.


Image Transformation
Below you can see the Lightroom before and after transformation. Please note, it took me only 4 simple adjustments without using the main editing tools.
Lightroom Histogram | Final Thoughts
As you can see this technique allows you to use Lightroom Histogram as a visual interactive editing tool. This approach works well with preset-based workflows when you need to adjust the Exposure before or after applying Lightroom Develop presets.