Ultrarunning and trail running have experienced explosive growth over the past several decades. In the United States alone, this proliferation has attracted new audiences and people from every corner of the country and beyond. This pattern is reflected globally as well.
The ultrarunning and trail running community is still relatively small, and you see similar faces at major events. With the commercialization of certain events and qualifiers attracting significant attention and selling out quickly, some races have ballooned from local events to national and international spectacles.
When looking through data available on ultramarathon statistics and past articles, many show growth graphs up and to the right. It is evident that ultrarunning is growing, but what does that really mean? How is it growing, and where is it growing?
As someone who has been traveling the United States over the past year and attending trail races in different states, I am interested in better understanding the crowd that these events attract. At a given trail race, you are bound to strike up a conversation with someone at the expo or as you shuffle down the trail. The laid-back nature of these events lends itself to conversation, and you learn a lot — maybe a little too much — about some folks.
It is always interesting to me where a person has traveled from for a particular event. Seldom is it the same location, and the geographic variance lends itself to learning about other cities and towns scattered across the country.
In this article, I aim to visualize the geographic reach of ultrarunning and trail running in the United States and how they unify dirt surfers from around the country and beyond.
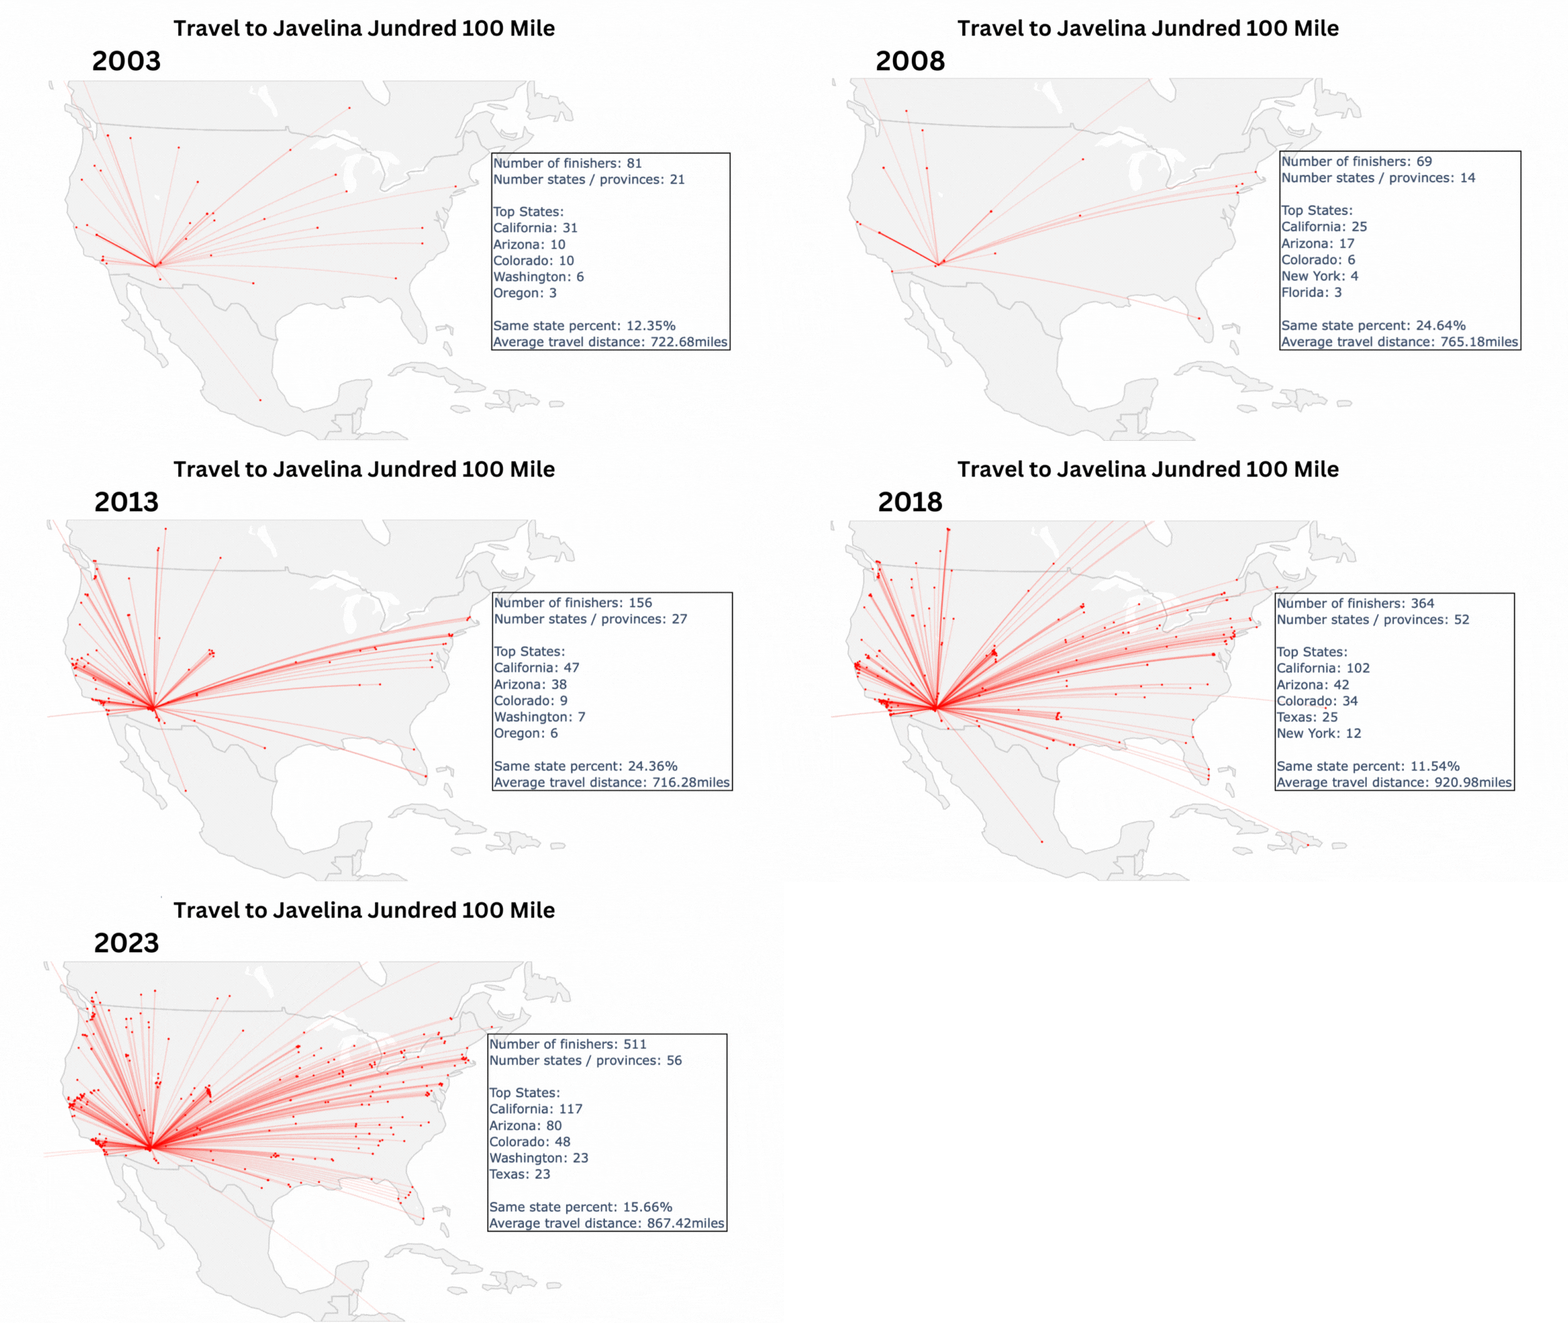
Let’s start by looking at one of the most high-profile ultras in the U.S., Javelina 100 Mile, and how it has grown over the years to attract misfits from around the country. Here, we visualize that geographic growth:
The growth is mesmerizing. From a small-time event that used to reach a handful of individuals, it has grown into a nationwide event that brings in people from most corners of the country and beyond. I aim to explore this concept further in this article: What does a geographic lens reveal about ultrarunning in the U.S.?
Methods and Notes
Notes on the data:
- Geographic constraint: Races in the U.S.
- Time constraint: Races from 2000 to 2023.
- Race size constraint: Races with at least 10 finishers.
- Participant constraint: Races only have individual data for finishers, not all participants.
These constraints will be on all data referenced in the article. For mapping location data, I used the Google Maps Geocoding API to retrieve latitude and longitude coordinates. All runner data comes from the DUV Ultramarathon Statistics Database.
A couple of last notes before we dig in:
- As we will see, the races featured in this article represent an overall trend in the development of U.S. ultrarunning and trail running.
- We want to clarify in this article that we are examining geographic growth in U.S. ultrarunning and trail running only. To do this, we use data on the number of events, their geographic locations, and the evolution of the geographies from which participants hail. There are other ways in which the growth of these sports can and have been measured, such as the overall number of participants within the events, that can give us other perspectives on growth.
Overall Ultramarathon Growth in the United States
This article examines the growth of ultrarunning in the U.S. through a geographical lens. Using the geocoded race and participant data, we can pinpoint and map where ultrarunning activity occurs around the country. I will start by looking at the growth of ultrarunning from a high level and then dive into some race-specific visualizations.
Ultrarunning is on the rise. Many people have probably seen a plot similar to the one below. This graph shows the number of ultra events in the U.S. over the years. Since 2000, the number of races in our dataset has grown from 233 to 2033, a 772% increase.
Here is what that growth has looked like across the country. Ultrarunning has gone from a fairly inconspicuous sport to being found across all states.
Drilling down into the ultra scene a bit more, it is interesting to see how the entry-level ultra distance, 50 kilometers, has grown compared to the most renowned ultra distance, 100 miles. The 50k has always been the most popular of the ultra distances with the lowest barrier to entry, and, except for some brutal 50ks like the Speedgoat 50k, more manageable to finish.
Since 2000, the number of 50k races in our dataset has grown from 89 to 760, a 753% increase.
This growth in 50k events is quite similar to the growth in all events, and we can see that a wide range of 50k events now exists across the county.
Examining 100-mile events over time, we see a growth from 19 events to 160, a 742% increase. The percentage increase in the 100-mile distance aligns with 50ks, but the absolute number of 100-mile races remains significantly less.
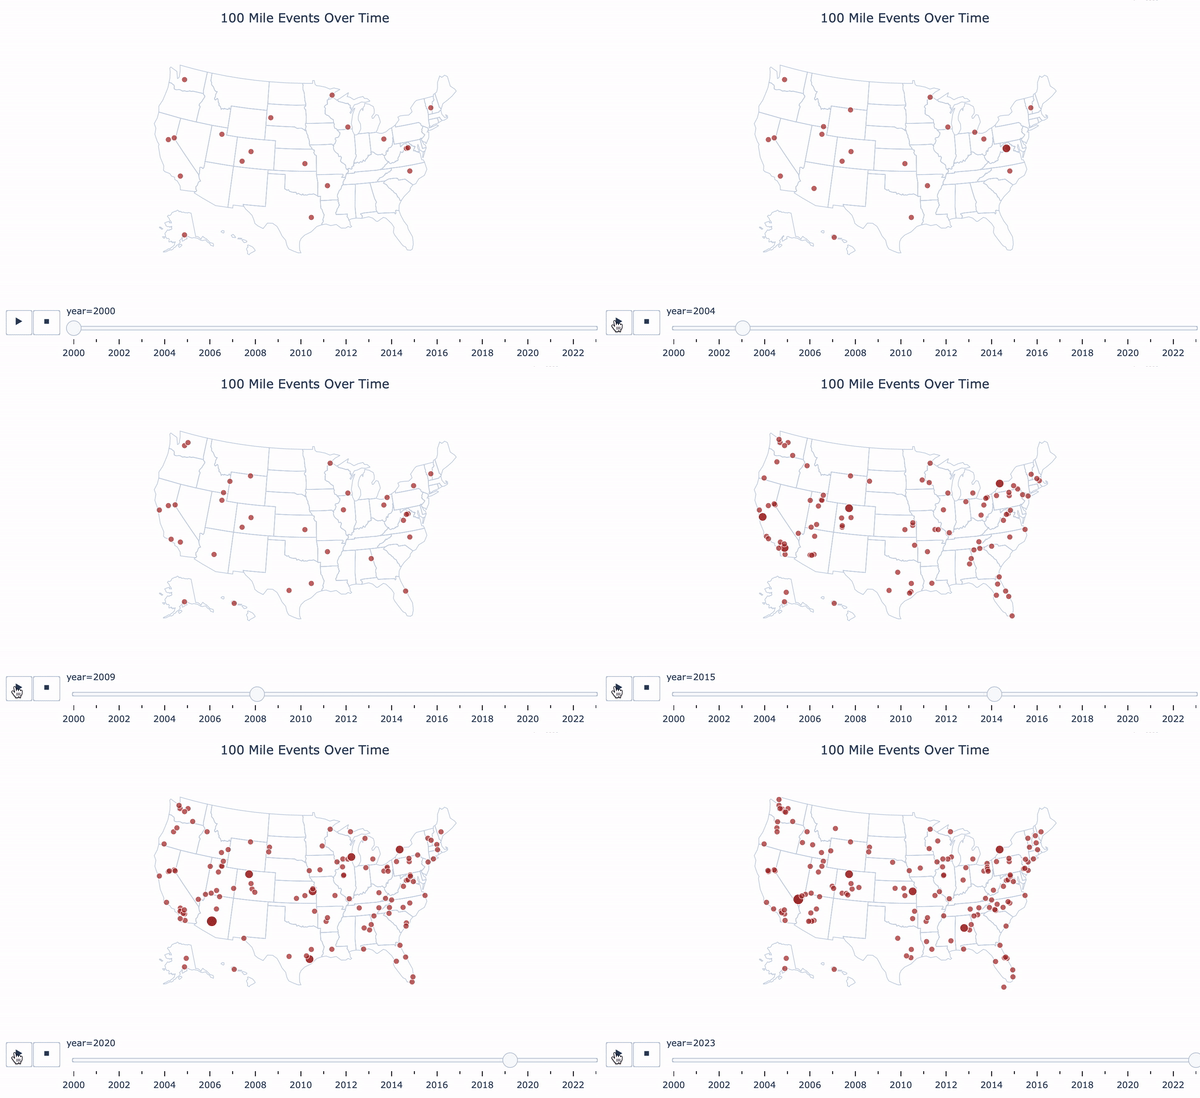
 Looking at a geographic distribution of 100-mile events, we can see they are quite spaced out. In 2000, there was seldom more than one per state, and in 2023, while more widespread, they are still much more spaced out than the 50k graph.
Here is an animation of how 100-mile races have spread over time:
Participant Travel to Various Ultramarathons in the United States
Ultras have grown over the years with more options for shorter and longer distances. If you want to find a race of a particular type relatively close to where you live, this has become more feasible. Some exceptions exist, such as if you live in a relatively ultra-dead zone. (Sorry, North Dakota.) Certain distances, such as the 50k, have more options to choose from, while less frequent events like 100 milers will make you search a bit harder. It makes intuitive sense that the more extreme or specific an event is, the more likely it is you will need to travel further to compete in it.
For example, let’s look at the Cocodona 250 Mile. It is the only 250-mile race in the U.S. in the DUV Ultramarathon Statistics dataset and one of a few 200-plus-mile races nationwide. Having grown to national prominence in the past few years, people are willing to travel from across the country to run from Black Canyon City to Flagstaff, Arizona.
Pulling location data for finishers at the event allows us to visualize travel to the 2023 Cocodona 250 Mile. As you can see, people travel from many parts of the country, with 35 states and provinces represented and an average travel distance of over 900 miles.
The location reflects that entered by the participant when signing up for a specific event.
Thinking about the Cocodona 250 Mile made me curious about what increases one’s propensity to travel long distances to events. Due to the data-intensive nature of geocaching every finisher’s location, I chose a select handful of events to examine in more detail. To examine trends by distance, I performed a small analysis using the top 10 most popular 50k races and 100-mile races in the dataset while excluding UTMB World Series races, as they did not include participant location information.
The two metrics I focused on were same-state percent — the percent of participants whose location was in the same state as the race, and average travel distance — the average distance in miles from a participant’s location to the event.
These metrics for 2023 race data reveal some interesting trends. On average, 50k races had a same-state percentage of 66.5%, while 100-mile races had a much lower same-state percentage of 34.5%. The average travel distance to 50k races was 266 miles compared to that of 589 miles for 100-mile races. These two metrics are nearly double for the 100-mile versus 50k, showing a willingness of participants to travel longer distances for longer-distance events.
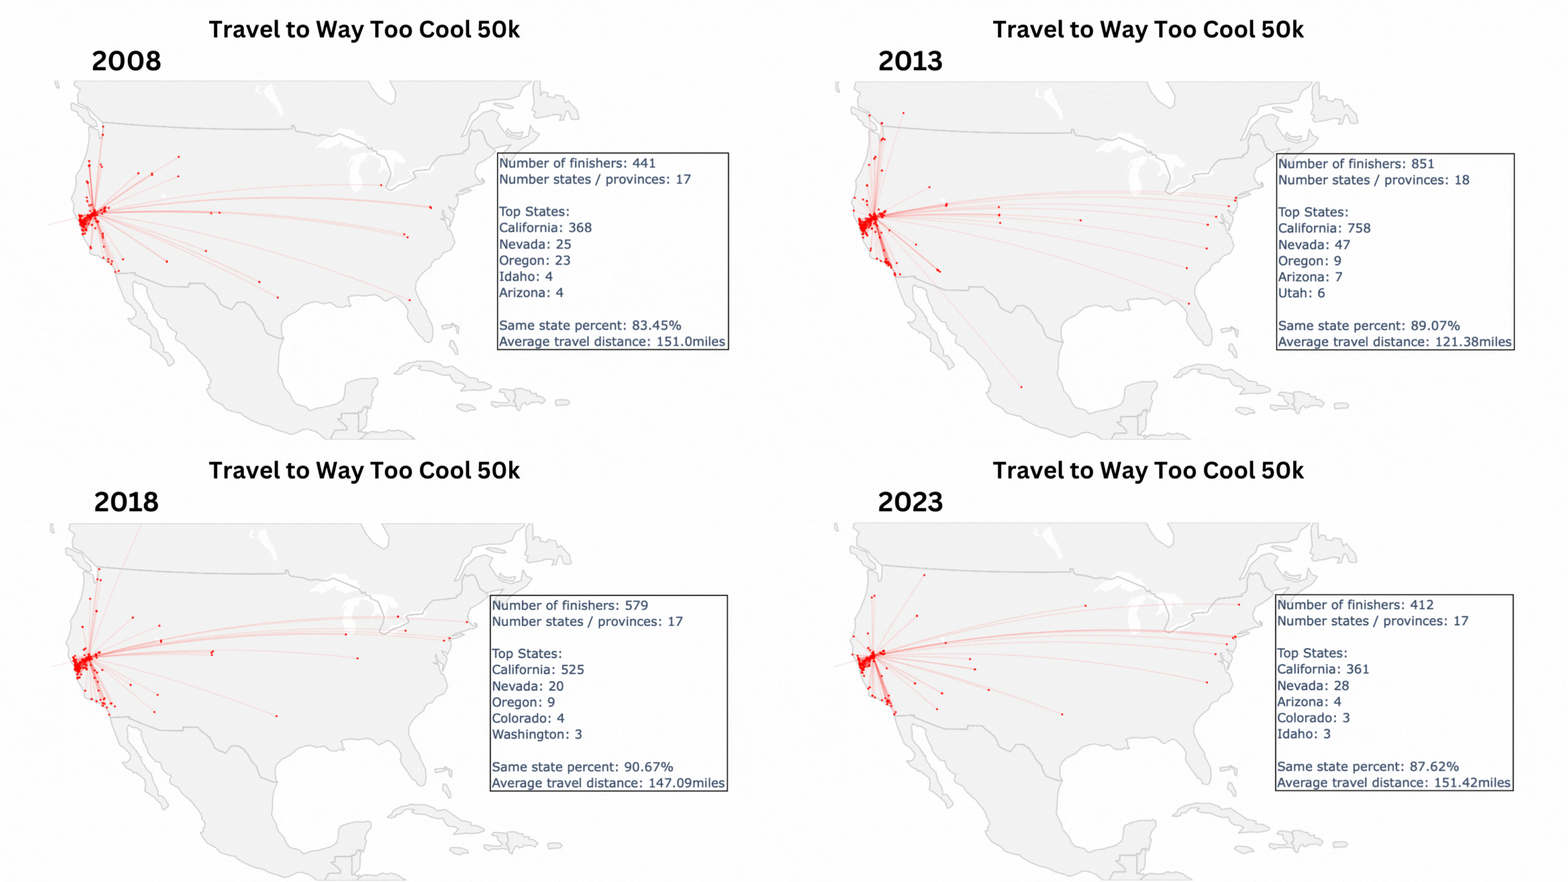
Here is a visualization of one of the more local 50k events, the Way Too Cool 50k in Cool, California.
As you can see, there isn’t much variation in where people travel from year to year. It is a predominantly California event, with 80 to 90% of participants from within the state.
On the other hand, let’s look at one of the more popular 100-mile events, the Javelina 100 Mile, near Fountain Hills, Arizona.
The Javelina 100 Mile started out as an event with more geographical reach due to the fact that 100-mile events have greater reach. Over the years, the growth across the country has been much more pronounced, with an increasing amount of participants traveling from across many states — and internationally — to attend the race.
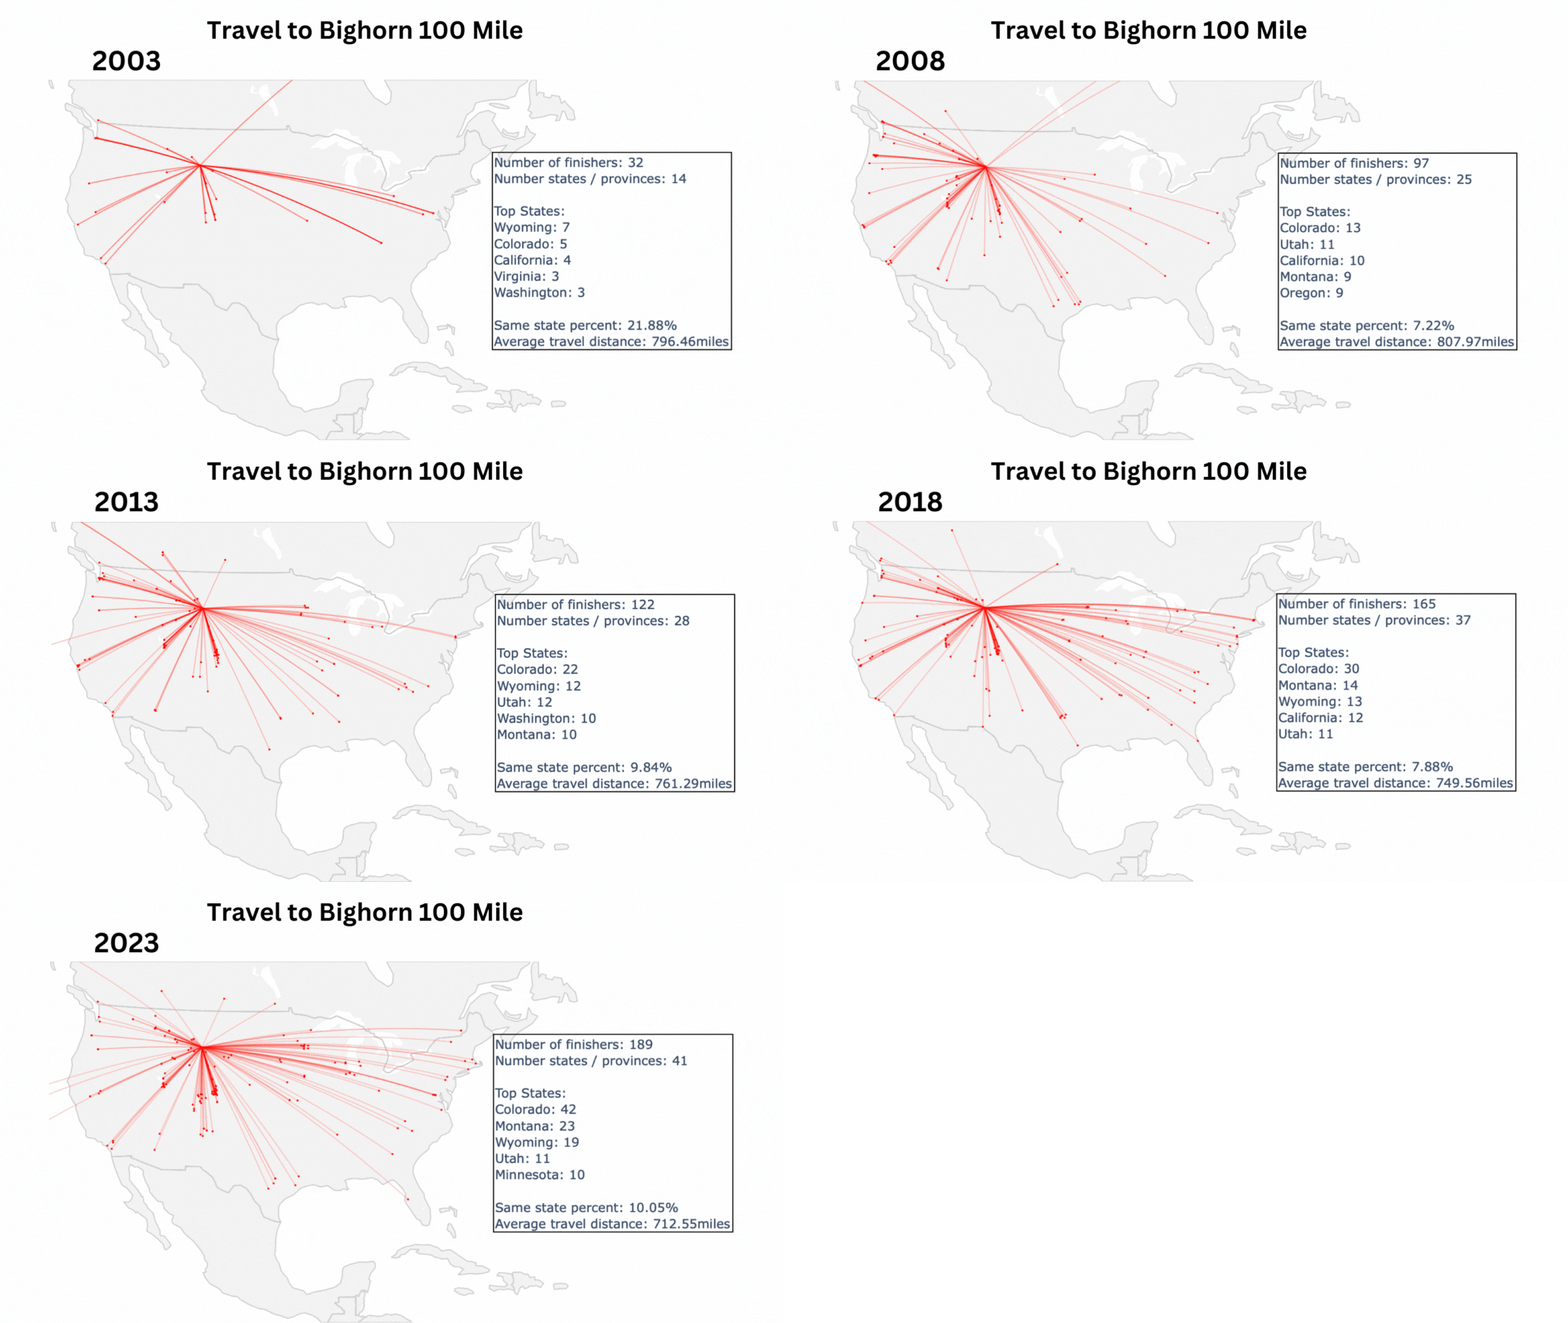
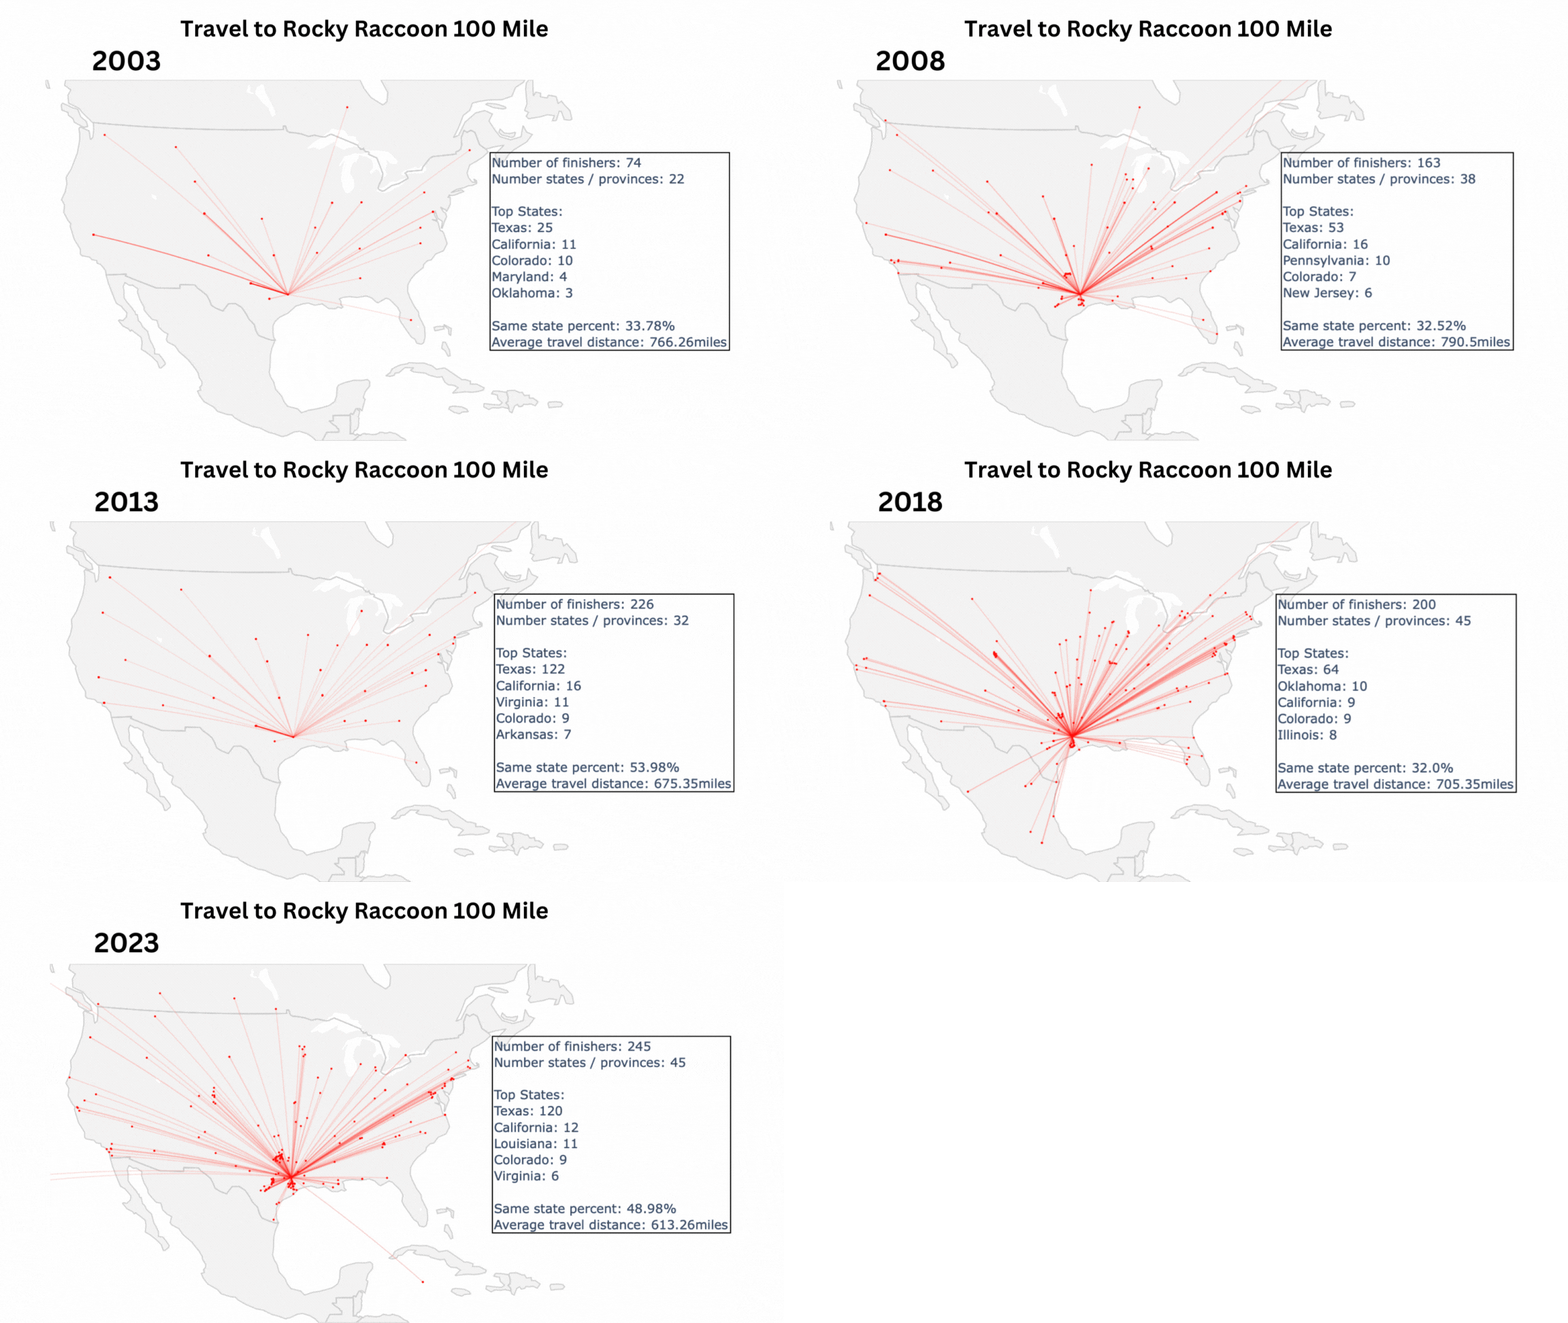
Travel trends like this can be seen across the 100-mile distance. Let’s look at a couple more examples.
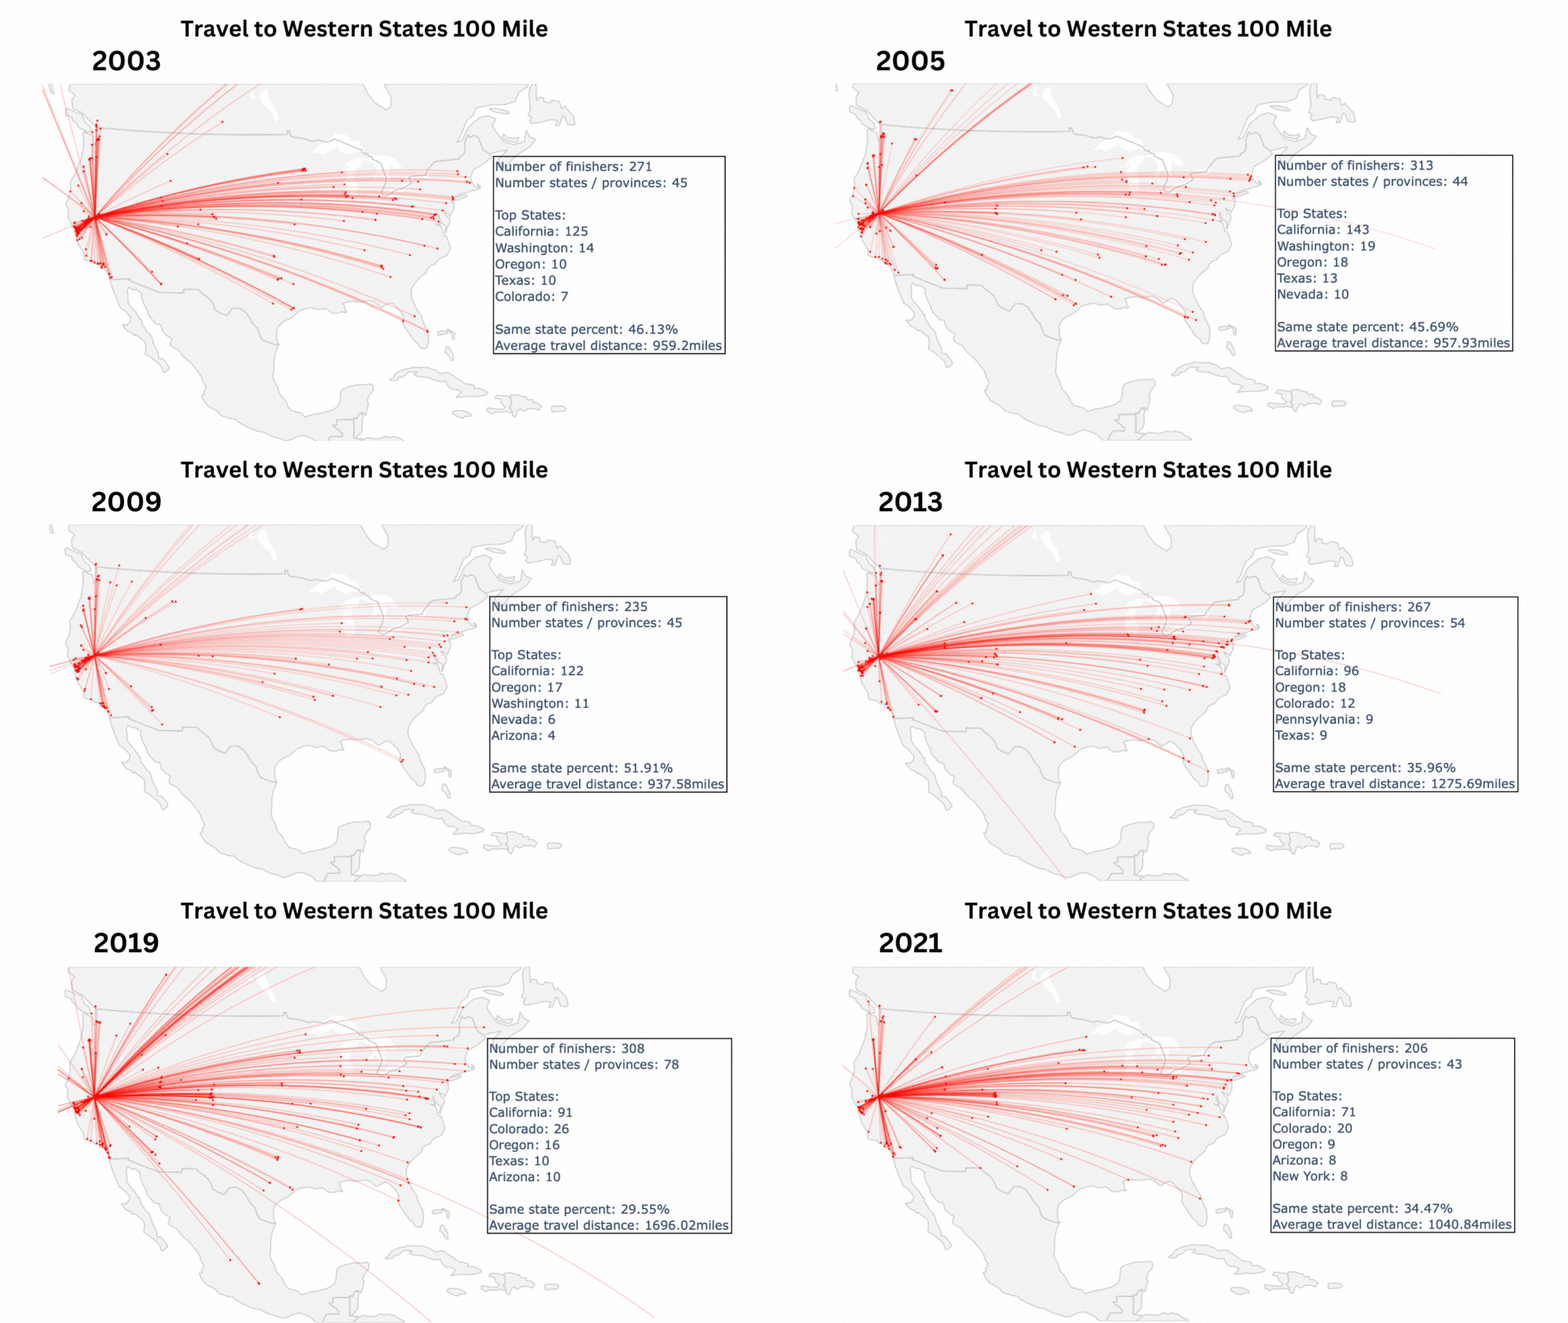
These three 100-mile events have attracted an increasingly wide range of folks nationwide. All three events are Western States 100 qualifiers and among the most popular races at their distance. Over time, as the interest in the 100-mile distance has grown, these events have grown along with it, spreading their reach to more states and provinces. The 2023 race view shows races with significant geographic reach, with all events selling out that year. Will these races continue to expand geographically in the years to come?
Looking at the Western States 100, we see a 100-mile race that has consistently been popular nationwide. Since 2003, the Western States 100 has consistently attracted people from more than 40 states and provinces, traveling an average distance of over 900 miles. These numbers have slightly increased over the years as the race continues to gain prominence on the international stage, but it is hard for it to become much more popular than it already is.
Ultramarathon Participant Propensity to Travel
Ultra-distance events have grown across the board in recent years. Shorter distance events, such as the 50k, and longer distance events, like 100-mile races, have both experienced this growth. Longer distance events remain more scarce and geographically spread out. This geographic dispersal and likely other factors result in participants being willing to travel further distances to these more unique events.
I am still finalizing my definition of participant propensity to travel (PPT), but it would likely include the following factors:
- Uniqueness of race: If a race distance is more unique, participants will travel further to race that distance.
- Qualifying races: The emergence of qualifying races for prestigious races makes these valuable in their own right.
- Location appeal: Ultras are often held in some of the country’s most beautiful places and are a good excuse to take an active vacation.
- Online presence: Social media and livestreams of the action as it takes place build hype around events, bringing in more folks the following year.
Ultrarunning’s growth across the U.S. over the years is fascinating to look at, and I’m sure it will continue to be in the years to come. By using a geographic lens to examine ultra growth over time, I hope I have provided a unique perspective on the sport’s growth.
Call for Comments
- What inspires you to run certain events?
- What makes you willing to travel further to a race?
- What other events would you like to see analyzed? (We’ll take a look into three additional nominees.)


